Note from MPWM: The views and market predictions expressed in this newsletter do not necessarily reflect the views of Momentum Private Wealth Management, LLC, or any of it's principals thereof.
Wild Week for Tesla
It was not my original intention to write about Tesla (TSLA) this week but several people reached out inquiring upon my thoughts regarding the stock so it feels appropriate to do so. I will start out by stating my personal opinion on the company is favorable. I admire the genius of Elon Musk and his passion fueling Tesla’s mission to accelerate the world’s transition to sustainable energy definitely resonates with me. Tesla is definitely a disruptive force that is striving to inject change and I respect that. Of course, Elon’s genius does not come without a cost and some of his Tweets and antics have had negative effects on the company’s image and stock price
.
For the last several years, TSLA has been moving rather lazily in a channel with the price drifting between 200 and 350. At the beginning of June of last year, TSLA hit its recent low of 176.99 but the stock rallied
136%
to close out 2019 at 418.33, firmly breaking out of its sideways trend channel. In January, the stock was up 56% but last week the stock took off hitting a midweek high of
968.99
.
Last Friday (2/7/2020), the stock closed at 748.07, firmly down from the midweek highs but still up nearly
80%
on the year thus far.
For the past few years, Tesla has been one of the most heavily shorted stock. In 2018 and 2019, there were fears that Tesla was burning through cash too quickly. For several quarters, Tesla missed guidance and in May of 2018, there was a particularly “bizarre” earnings call that further undermined investors’ confidence.1 The U.S. Securities and Exchange Commission disciplined Musk in April of last year over his use of Twitter in conjunction with Tesla’s stock price. Needless to say, it has been anything but a smooth, luxurious ride for Tesla investors
.
Bring in the Short Squeeze
Short-selling a stock is when an investor borrows shares and immediately sells them with a promise to repay the lender at some future date. The lender also charges nominal interest on the borrowed shares. Short-sellers are essentially betting against the market and make money when an equity decreases in price. Instead of wanting to buy low and sell high, short-sellers want to sell high and buy low. Below is a simple example to illustrate:
- I enter into a short position 10 shares of XYZ Corporation that is trading at $100.
- My broker (that loaned me the shares) deposits $1000 into my account.
- One month later, XYZ is trading at $90 and I decide to take profits.
- I buy 10 shares to cover my short position at $90 and pay $900 to settle up with my broker that loaned me the 10 shares.
- I keep the $100 difference (less an interest accumulated.)
Of course, had the price of XYZ increased to $110 per share, I would have been in a losing position because it would have cost me $1100 to buy back the shares I borrowed.
All traders have a finite amount of risk they are willing to contend with. In other words, we all have a threshold of pain for losses. When an equity, such as TSLA, has a significant percentage of shares that are floating short, a modest rally in price can become exacerbated because short-sellers are covering their positions - buying the stock to get out of their losing positions - which provides further upside pressure and sends the stock price soaring. The faster the stock begins to appreciate, the more pain the short-sellers feel and the more apt they are to cover their positions
On Monday (2/3/2020), TSLA closed up 130 points and reportedly cost the short-sellers a collective
$2.5 Billion
. Yes, that is a
lot
of pain. In fact, Monday through Thursday of last week, short-sellers covering positions accounted for nearly
25%
of the daily volume in TSLA stock.
Of course, if one already has a bias to the downside, as price gets higher and higher, it is tempting to enter (or re-enter) into a short position. As TSLA crested the 800 and 900 price thresholds, short-sales picked up and now the open short interest, as of Friday (2/7/2020), is nearly 25 Million shares or about 19% of the total shares in circulation. And so, the cycle repeats itself. It is the classic struggle between the bulls and bears.
Where the rubber meets the road
Tesla’s move this past week certainly made headlines and captivated people’s attention. So, where does the stock most likely go from here? Moves of this magnitude are rarely sustainable. In my opinion - and I, personally, have no intention of entering into a long or short position in TSLA in the near-term - I believe the daily chart will need to cycle through and “reset” before further price appreciation can occur. This means price will either drift downwards or generally move sideways. Let’s take a closer look:
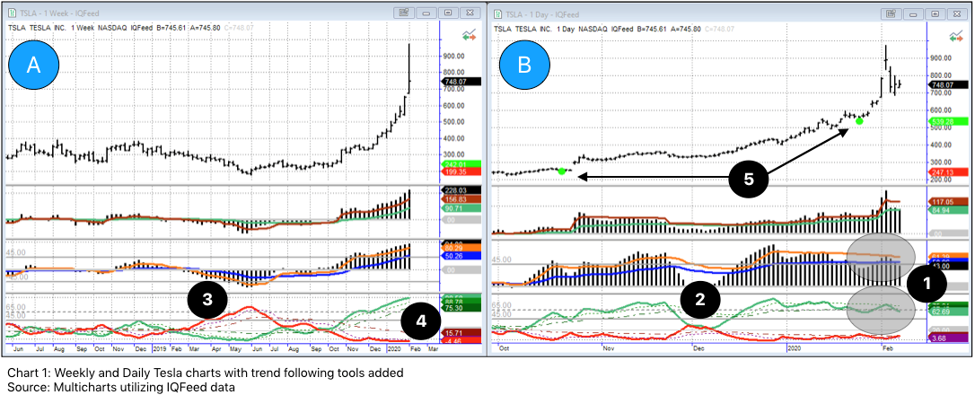
Chart 1 is a side-by-side weekly (chart A) and daily (chart B) view. Remember, five daily bars make up one weekly bar. The three sub charts below price are proprietary indicators that measure underlying strength of the stock as well as strength of trend. Looking at chart B, the daily, the first thing that jumps out to me is there is significant divergence in two of the indicators denoted by the shaded areas near #1. Divergence is when there is a new high in price but there is not a corresponding new high in the indicator. Markets can continue to move higher when divergence is present, however, underlying strength has been lost. You can see in the shaded ellipses the values corresponding to the highs of price are lower than prior values.
Earlier I mentioned that I believe the daily price needs to cycle and “reset” before price can move higher. This does not necessarily mean a significant selloff. On chart B, point #2 illustrates an indicator “reset” the enabled this most recent rally. The price bars are somewhat distorted because of the magnitude of the recent bars but price drifted slightly lower and mostly moved sideways during this reset time.
Moving to the weekly chart (A), you can see the June low that was referenced at the beginning of this article. The value of the red line in the trend indicator at point #3 peaked at 77. It is not uncommon to see trend changes when this value exceeds 75, which is what played out. Sliding over to point #4, the current value is 98.58!! This reflects the significance and strength of the move but also points to the fact this stock is severely over-bought. Price action itself is indicating a weakening market as the last three days were off the high and the weekly bar closed in the bottom third of its range. These are not positive indications.
As I see it, there is not a clear indication of where price will likely go from here; not enough for a significant edge and I only trade when I feel I have an advantage. Incidentally, there were two very clear buy signals (denoted by #5), according to my proprietary software, that signaled in October of last year and again during the last week of January. Entering at these decisive points gives much more of an advantage and are quite profitable when properly executed. A clear advantage is what I gravitate towards in selecting my trading portfolio.
Don’t switch on the Autopilot
In my last article,
“Crashing Up?”
, I referenced the Tulip Mania of the 16th Century and FOMO (Fear of Missing Out). It is easy to get swept up in the illusion of fast and easy money. In the article before that, “2020 Vision”, I put forth the theory that the current S&P 500 market has a remarkably similar look and feel to the pre-Tech Wreck market of 1999. Tesla’s price action this past week made me remember back to 1999 and 2000, when significant gains in equities were a common occurrence, especially within the communications space.
The first stock I thought of was JDS Uniphase (JDSU) as I recall wild swings in price; fortunes made in mere days. In late 1999, the stock soared from around 200 to over 1200 per share. JDSU is no longer a publicly traded company so I cannot get the data to plot a chart, however, Juniper Networks (JNPR) and Qualcomm (QCOM) are still actively traded and Chart 2 below illustrates the meteoric assent of these two companies in 1999 and 2000 side-by-side next to TSLA today.
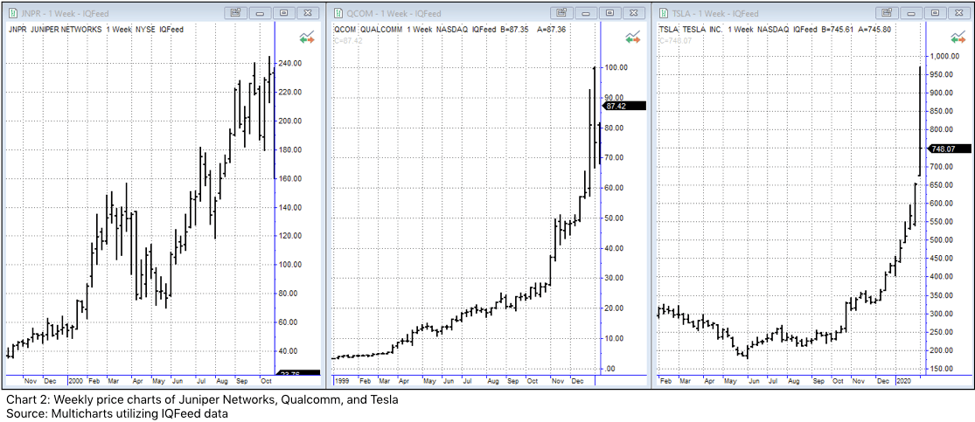
The shape of the price curves vary from one company to the next but all three show significant price appreciation. JNPR went from around $40 a share to crest above $240 per share (6x growth). In about the same duration (not exactly the same time period), QCOM went from below $5 per share to peak at $100 per share (over 20x growth!)
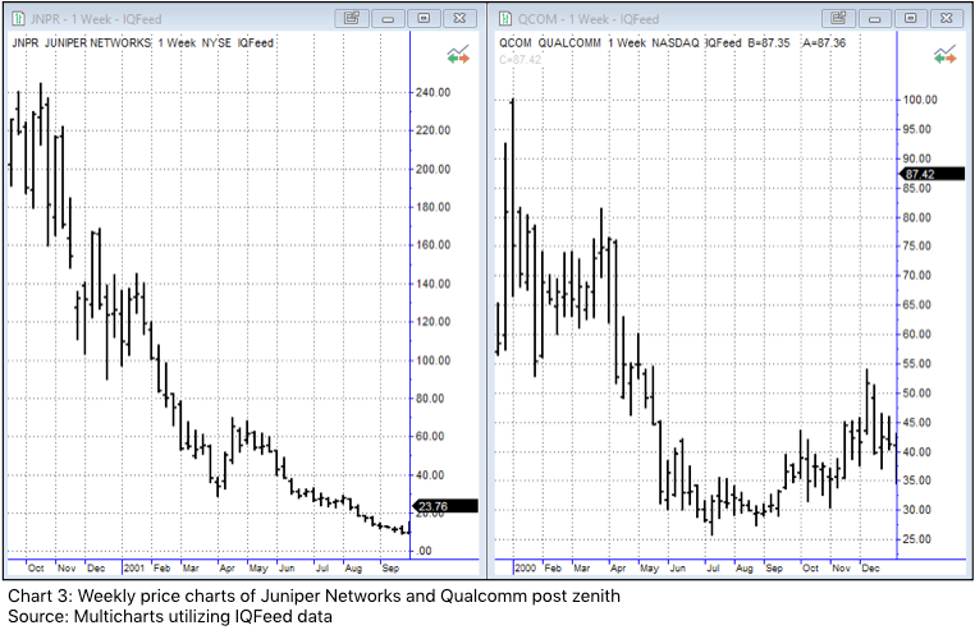
Chart 3 illustrates the twelve months following their zenith. Yes, these stocks, along with all of the other tech stocks fell victim to a broader market selloff. Neither of these stocks, Juniper Networks nor Qualcomm, have traded at their 1999 / 2000 levels at any point over the last 20 years despite the broader market indices being significantly higher. Both of these stocks rose on hype, herd mentality, and FOMO. Because there was not underlying, intrinsic valuation present, these stocks - and many others like them - gave back most of their gains and haven’t seen those levels since. If the broader market turns, I believe Tesla is more exposed than other stocks because of its rapid gains of late, should there be a broader change in market sentiment. Short-squeezes are not the most stable of foundations for stock prices to build from.
Remember Chart 1, above? Compare it to Chart 4 below. Some of the similar indicator attributes existed in QCOM’s weekly chart from 1999 - trend following indicator at 95 coupled with divergence and resistance from moving averages - that currently exist in TSLA’s daily chart.
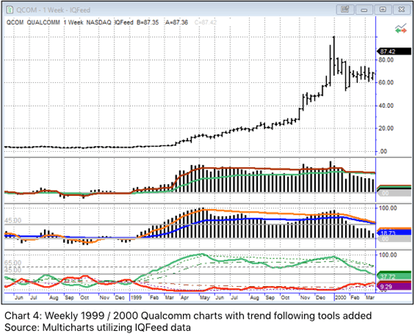
Daily and weekly comparisons are not exactly apples-to-apples, but the point is, the formations are similar and play out consistently over time. Therefore, I believe Tesla’s market high is in for now; the charts appear to need to cycle and turn over.
When the market is near all-time highs, it is a perfect time to review your portfolio and talk to a professional you trust to ensure your investments are working toward your long-term goals. After significant market moves, portfolio recalibration can be helpful.
Disclosure:
At the time of writing, I have no open position in any aforementioned company. I have not received compensation for this piece, nor do I have business relationships with any company whose stock is mentioned in this article. I wrote this newsletter myself and it expresses my own thoughts, opinions, and views.
1. blogs.wsj.com (https://blogs.wsj.com/moneybeat/2018/05/03/spurned-tesla-analysts-arent-pleased-with-bizarre-earnings-call/)
2. businessinsider.com (https://markets.businessinsider.com/news/stocks/tesla-stock-price-gain-short-sellers-down-billions-one-day-2020-2-1028869336)
3, fintel.io (https://fintel.io/ss/us/tsla)
4. shortsqueeze.com (http://shortsqueeze.com/shortinterest/stock/TSLA.htm)
Justin Toedtman is a market strategist and contributing editor to Momentum Private Wealth Management. For the last 20 years, his focus has been on technical analysis and market strategies.
If you are not having frequent conversations with your wealth or investment advisor about market strategies, investment management, or financial planning opportunities, you should be. Momentum Private Wealth Management specializes in Wealth Management as well as Comprehensive Financial Planning. Feel free to reach out to Austin directly at 512.416.8085 or austin@momentumpwm.com. You can also find out more information about MPWM at: www.momentumpwm.com .
The information on this site is provided “AS IS” and without warranties of any kind either express or implied. To the fullest extent permissible pursuant to applicable laws, Momentum Private Wealth Management, LLC (referred to as “MPWM”) disclaims all warranties, express or implied, including, but not limited to, implied warranties of merchantability, non-infringement, and suitability for a particular purpose.
MPWM does not warrant that the information will be free from error. None of the information provided on this website is intended as investment, tax, accounting or legal advice, as an offer or solicitation of an offer to buy or sell, or as an endorsement of any company, security, fund, or other securities or non-securities offering. The information should not be relied upon for purposes of transacting securities or other investments. Your use of the information is at your sole risk. Under no circumstances shall MPWM be liable for any direct, indirect, special or consequential damages that result from the use of, or the inability to use, the materials in this site, even if MPWM or a MPWM authorized representative has been advised of the possibility of such damages. In no event shall MPWM have any liability to you for damages, losses, and causes of action for accessing this site. Information on this website should not be considered a solicitation to buy, an offer to sell, or a recommendation of any security in any jurisdiction where such offer, solicitation, or recommendation would be unlawful or unauthorized.